

In this article
What do GEX and DEX measure?
GEX refers to Gamma exposure and DEX to Delta exposure. An exposure estimate combines an option sensitivity with quantities, contract scaling and assumptions about position signs. The label does not specify a universal calculation.
To read a crypto options exposure chart, establish which contracts and sources contribute, what the output unit represents and how positive and negative positions are assigned. An identical label can conceal different formulas or scaling conventions.
Public open interest supplies an outstanding quantity. It does not reveal a complete signed inventory for a particular dealer or participant. A model built from it needs to keep that distinction explicit.
Read the sensitivity before the aggregate
Delta describes the sensitivity of an option value to the underlying price. Gamma describes how Delta changes with the underlying price. Their exposure totals therefore answer different questions and use different scales.
Vanna describes Delta’s sensitivity to implied volatility. Charm describes Delta’s change with time. For Charm, advancing calendar time and reducing time to expiry use opposite time directions; the stated convention is needed to interpret a sign.
These are local model sensitivities. Multiplying them by a quantity does not remove their dependence on price, volatility, time and other model inputs. A changed estimate can result from changed inputs even if the assumed position quantity is held fixed.
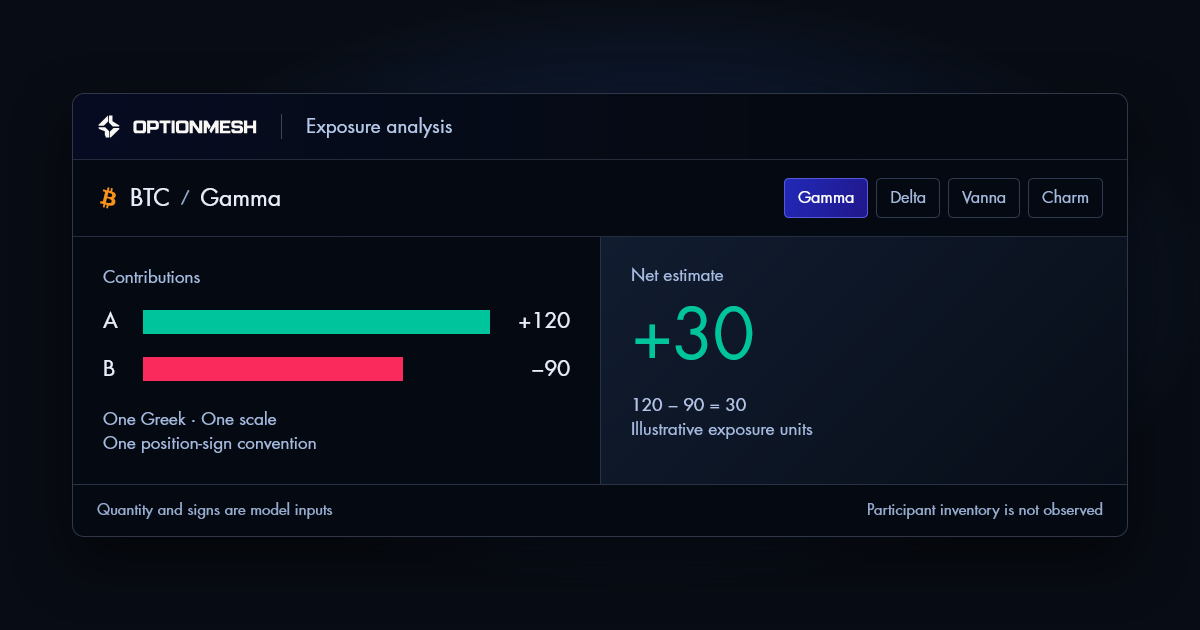
Worked example: +120 and −90 produce +30
Assume two contributions have already been calculated using the same Greek, unit and model convention. One is +120 exposure units and the other is −90. Their net estimate is +30 units.
| Contribution | Exposure units |
|---|---|
| A | +120 |
| B | −90 |
| Net estimate | +30 |
The arithmetic is 120 − 90 = 30. It does not identify who owns either contribution. If the assumed sign of the second contribution were changed to positive, the same magnitudes would instead sum to +210. That difference comes from the position assumption, not from discovering another trade.
Adding a Delta exposure number to this Gamma example would be invalid because the units describe different sensitivities. A net total also needs its coverage: an unavailable contribution cannot be silently assigned zero.
Read a strike concentration with its scope
A large bar at a strike describes a concentration in the selected model output. Check whether it covers one expiry or several, one source or a selected set, and whether its quantity inputs share a comparable observation time.
The strike may become more or less prominent when the reference price, IV inputs or included contracts change. Compare the same scope and convention before calling the difference a change in positioning.
A positive or negative estimate alone cannot establish the hedging action of a named participant or predict the next underlying price move. Those claims would require evidence beyond a public open-interest total and assumed signs.
Inspect contract identity and units before combining contributions
Use the OptionMesh views for distinct questions
The GEX · DEX · Vanna · Charm demonstration contains Summary, Spot, Gamma, Delta, Vanna and Charm views. Use the selected sensitivity and labels to identify which question the panel is addressing.
Keep the output scale with the chart when changing views. A visually similar bar is not enough to compare two Greeks. Consult the relevant data and methodology information for the available inputs, then treat a demonstration as an explanation of the interface rather than evidence of a current participant book.
Before comparing two exposure estimates
- Name the Greek, output unit, scaling rule and position-sign assumptions.
- Keep underlying, expiries, source scope and observation times comparable.
- Separate observed input quantities from assumed positions and calculated sensitivities.
- Check exclusions and unavailable contracts before interpreting a net total.
- Read a change in the estimate alongside changes in its inputs and coverage.
References & further reading
- OIC: understanding option Greeks
- OIC: Greek exposure and second-order sensitivities
- OIC: what open interest can establish
- OptionMesh: data, measures and their limits
Examples are educational. An illustrative calculation does not establish production coverage or a trading recommendation.